Home » 3 Easy Graphing Activities For Kindergarten
Teachers, are you looking for a way to help your kindergarten students understand graphing? It’s actually not as difficult as you might think! This blog post will explore what graphing is and why it’s essential for young learners. We’ve also got three fun graphing activities for Kindergarten that are free to download.
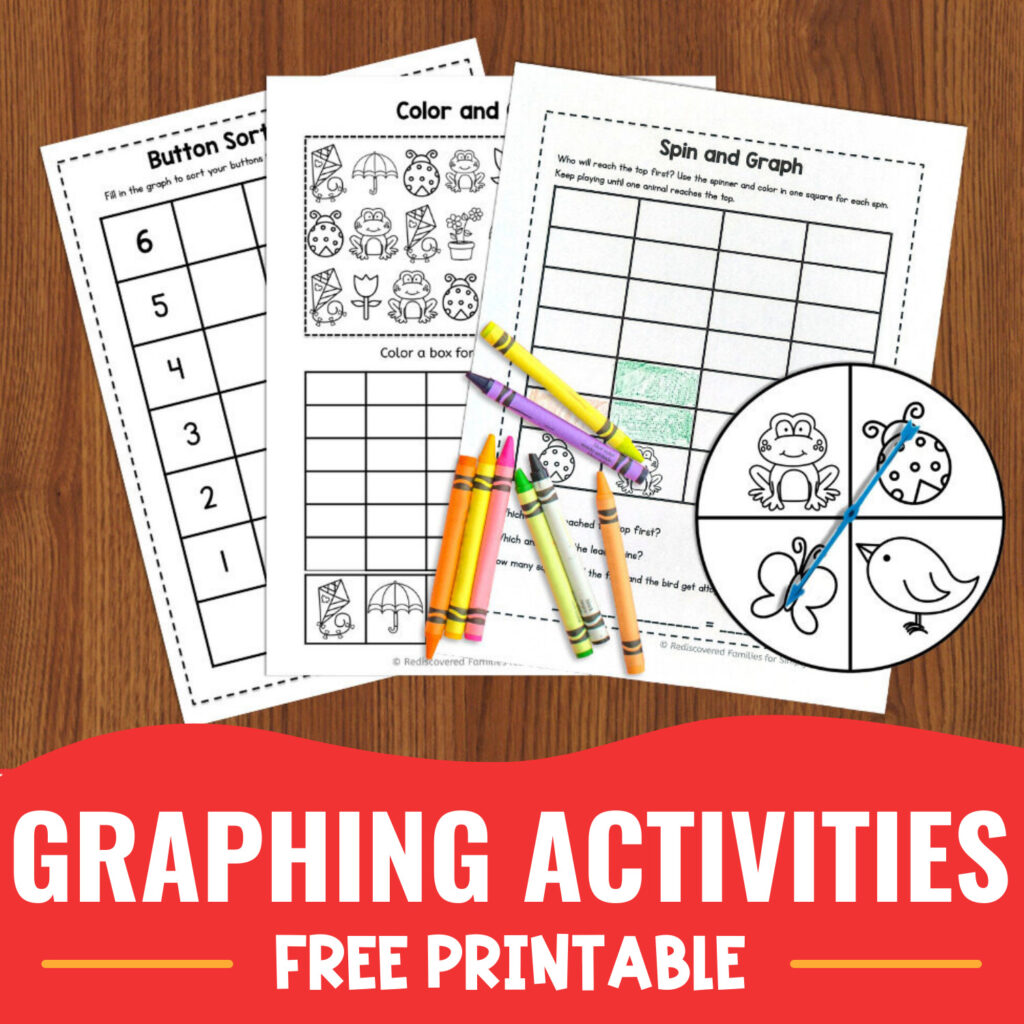

A graph is a visual representation of data designed to show the connection between two or more quantities. A graph helps us collect and organize data in an understandable way. Once we have created the graph, we can quickly answer questions about the data.
In Kindergarten, we use graphs to sort objects by different categories. Count the number of things in each category. We can also use them to compare numbers.
Graphing is a great way to introduce Kinders to data collection and analysis at an elementary level. Creating simple graphs will also introduce them to graphing words like bar charts and columns.
There are many mathematical concepts involved in graphing, and these include
So you can see that graphing packs a lot of learning into one activity. Don’t you just love that?
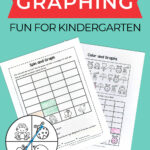
It’s never too early to start teaching graphing! Your student is going to need lots of practice to master this skill. So, we’ve designed three simple graphing activities for Kindergarten to help you get started.
One of the easiest ways to start is to use a simple bar graph where one square equals one object. Children quickly pick up on the idea of counting one thing and filling in one square. The heights of the various columns in the bar graph are a helpful visual cue. They tell us which columns have more objects and which have fewer. One quick glance can help us compare the numbers of two or more columns.
This activity involves hands-on experiences and uses colored buttons to create a bar chart. Students will sort a handful of buttons into four colors. Then use the graph to compare the numbers of each color.

Kids love I-spy games and coloring, so they will enjoy this activity. Invite students to choose one color for each object. Invite students to color each image in turn and fill in one box for each image found.
Students use a spinner to determine which square they should color on the graph.
You may find this quickly becomes a favorite for your students. Most kids love spinning, and it flows nicely into graphing. It is a simple way for students to collect their data as they must record after each spin.
There are also a few questions to complete after the activity is finished. These are designed to help children start to analyze the data. We have provided a number line for any student who needs help with the addition question.
Preparation is easy. Push a plastic spinner through the center. Simply print out the spinner on cardstock and laminate if you wish. Print the graphing sheets on paper, and you are ready to go.
If you don’t have a plastic spinner on hand, you can use a brad and paper clip.
Graphing is an essential skill for kids to learn, and you can lay a good foundation at the Kindergarten level. Teaching graphing to kindergarteners can be challenging, but it’s definitely worth the effort. We hope that our graphing activities for beginners help get you started.

With Unmatched Printables & Engaging Classroom Ideas, Simply Kinder is your TRUSTED TEAMMATE.
Get our emails loaded with free resources, teaching ideas, and so much more!

You might also like: