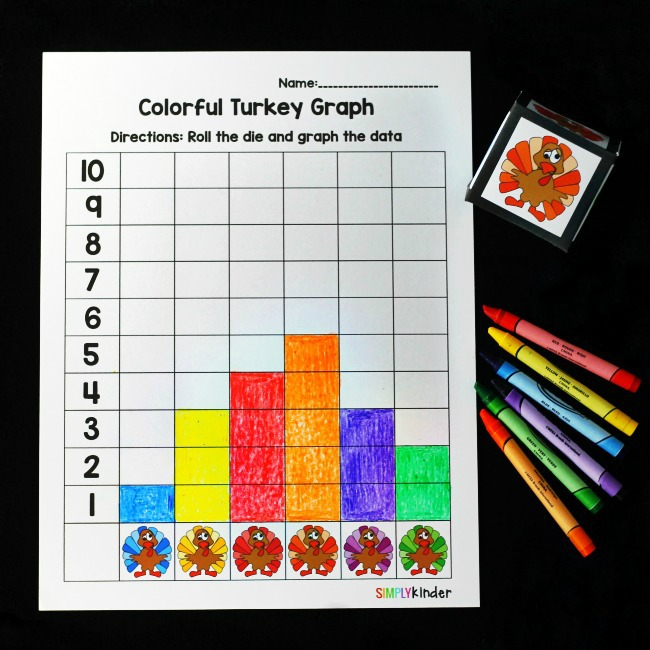


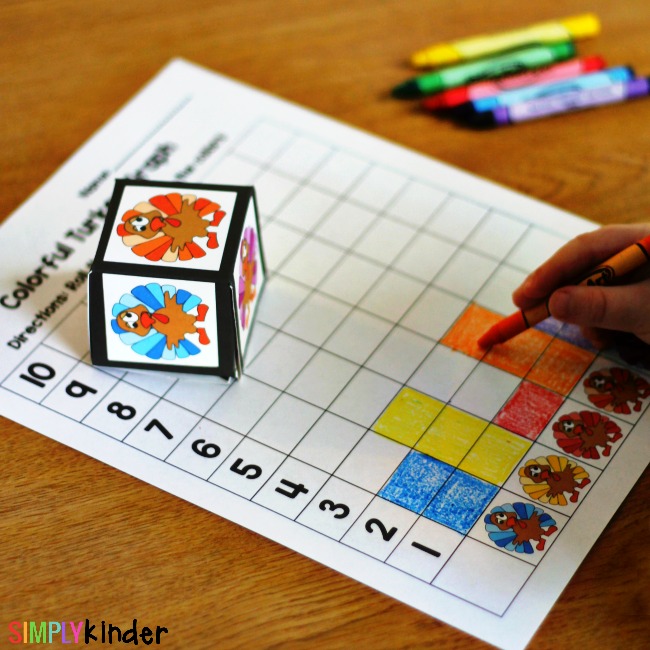
Thanksgiving is just a couple of weeks away so we are learning all about turkeys. We love to incorporate seasonal things into our learning activities, so we are graphing different colored turkeys in our math lesson today. The Colorful Turkey Graph is a fun way for children to not only practice counting and graphing, but they can also learn how to read and interpret data.

This activity works well with these resources:
The Colorful Turkey Graph can be a whole class activity, set up as a math center, or given to early finishers.
For a math center, you can print 4 or 5 graphs depending on the size of your groups and laminate them. Then, have your students use dry erase markers instead of crayons to graph the colors.
If your color ink and copies are limited, there is a black and white die and graph included in the download too. (Select to print pages 4 and 5) You can have your students color the turkey’s specific colors or even have them pick their own colors.
After collecting the data, students can work together with a partner or as a whole class to interpret the data and answer questions about their graphs such as which color had the most or which color had the least blocks colored. You can also create simple math problems like what is the sum if you add the blue and green turkeys together.
The Colorful Turkey Graph is a great activity for your students to practice counting, graphing, and reading data. It’s also a fun way to get children excited for the upcoming holiday.
Don’t forget to download the Colorful Turkey Graph Printables!